
The 2017 ACM DEBS Grand Challenge is the seventh in a series of challenges which seek to provide a common ground and uniform evaluation criteria for a competition aimed at both research and industrial event-based systems. The goal of the 2017 DEBS Grand Challenge competition is to evaluate event-based systems for real-time analytics over high velocity and high volume data streams.
The focus of the 2017 Grand Challenge is on the analysis of the RDF streaming data generated by digital and analogue sensors embedded within manufacturing equipment. The goal of the 2017 Grand Challenge is to implement detection of anomalies in the behaviour of such manufacturing equipment.
This year’s Grand Challenge is co-organized by the HOBBIT (https://project-hobbit.eu/) project represented by AGT International (http://www.agtinternational.com/). Both the data set and the automated evaluation platform are provided by the HOBBIT project. This will allow us to offer the possibility of running a distributed solution on multiple VMs. Details about the data, queries for the Grand Challenge, and the evaluation process are provided below.
 |
 |
 |
The HOBBIT project has received funding from the European Union’s H2020 research and innovation action program under grant agreement number 688227.
Prize
Participants in the 2017 DEBS Grand Challenge will have the chance to win two prizes. The first prize is the “Grand Challenge Award” for the best performing, correct submission. The winner (or winning team) of the “Grand Challenge Award” will be additionally awarded with a monetary reward of $1000.
The second prize is the “Grand Challenge Audience Award” – it is determined based on the audience feedback provided after the presentation of the Grand Challenge solutions during the DEBS 2017 conference. The “Grand Challenge Audience Award”, as opposed to the overall “Grand Challenge Award”, does not entail any additional monetary reward as it is based purely on the audience perception of the presentation of a given solution.
Support
We would like to explicitly thank Weidmüller (http://www.weidmueller.de/) for the provisioning of the original data set that AGT International used to generate a realistic data set for the purpose of this challenge.
Challenge
The 2017 DEBS Grand Challenge focuses on two scenarios that relate to the problem of automatic detection of anomalies for manufacturing equipment. The overall goal of both scenarios is to detect abnormal behavior of a manufacturing machine based on the observation of the stream of measurements provided by such a machine. The data produced by each sensor is clustered and the state transitions between the observed clusters are modeled as a Markov chain. Based on this classification, anomalies are detected as sequences of transitions that happen with a probability lower than a given threshold.
The difference between the first and the second scenario is that in the first scenario the number of machines to observe is fixed, while in the second scenarios new machines dynamically join and leave the set of observable machines. In the following we provide a description of the input and output data (together with their format) and the query that will evaluate the behavior of the machines under observation as well as the description of the parameters and the expected output format.
Data
The data set comes from two types of machines: (1) injection molding machines and (2) assembly machines. Injection molding machines are equipped with sensors that measure various parameters of a production process: distance, pressure, time, frequency, volume, temperature, time, speed and force. All the measurements taken at a certain point in time result in a 120 dimensional vector consisting of values of different types (e.g., text or numerical values). Assembly machines are equipped with 3 energy meters. Each measurement for both types of machines is timestamped and described using the OWL ontology. The OWL ontology is provided as several modules that are available and documented on the HOBBIT CKAN site.
All data is provided as RDF triples. The data is provided as (1) metadata and (2) measurements. Metadata includes information about the machine type, the number of sensors per machine and the number of clusters that must be used in order to detect anomalies in the data. Measurements include the actual sensor data as measured by sensors within the machines. We refer participants to this document for additional information and excerpts of the input data.
We provide two sample input data sets under the following FTP address: ftp://hobbitdata.informatik.uni-leipzig.de/DEBS_GC/.
Measurements and Metadata
For both scenarios, we provide one input stream of RDF tuples plus a file containing the metadata for all the machines (injection molding and assembly) to which tuples refer to. The following is a sample of the input stream containing a value for one dimension. We refer the reader to additional data description document for information about the RDF format of the input tuples and the metadata provided for the machines.
debs:ObservationGroup_1 rdf:type i40:MoldingMachineObservationGroup.
debs:ObservationGroup_1 ssn:observationResultTime debs:Timestamp_1.
debs:ObservationGroup_1 i40:contains debs:Observation_1.
debs:ObservationGroup_1 i40:machine wmm:MoldingMachine_1.
debs:ObservationGroup_1 i40:observedCycle debs:Cycle_2. debs:Cycle_2 rdf:type i40:Cycle. debs:Cycle_2 IoTCore:valueLiteral "2"^^xsd:int. debs:Timestamp_1 rdf:type IoTCore:Timestamp. debs:Timestamp_1 IoTCore:valueLiteral "2016-07-18T23:59:58"^^xsd:dateTime. debs:Observation_1 rdf:type i40:MoldingMachineObservation. debs:Observation_1 ssn:observationResult debs:Output_2. debs:Observation_1 ssn:observedProperty wmm:_9. debs:Output_2 rdf:type ssn:SensorOutput. debs:Output_2 ssn:hasValue debs:Value_2. debs:Value_2 rdf:type i40:NumberValue. debs:Value_2 IoTCore:valueLiteral "-0.01"^^xsd:float.
Output
As for the input stream, the stream of results of the submitted solution should be provided as a stream of RDF tuples. A sample output is shown in the following. We refer the reader to the additional data description document for information about the RDF format of the output tuples. Please notice that the output data stream should be ordered by the application timestamp.
# anomaly in the first machine in the first dimension
debs:Anomaly_1 rdf:type ar:Anomaly.
debs:Anomaly_1 i40:machine debs:Machine_1.
debs:Anomaly_1 ar:inAbnormalDimension debs:ObservedProperty_1.
debs:Anomaly_1 ar:hasTimeStamp debs:TimeStamp_1.
debs:Anomaly_1 ar:hasProbabilityOfObservedAbnormalSequence 0.1.
Query
The query has three stages: (1) Finding Clusters, (2) Training a Markov Model and (3) Finding Anomalies. The figure below illustrates the query stages as NFA. Note that, once started, the activities for each stage are executed continuously and never stop, e.g., cluster centers are continuously evaluated while the Markov model is already used for anomaly detection.
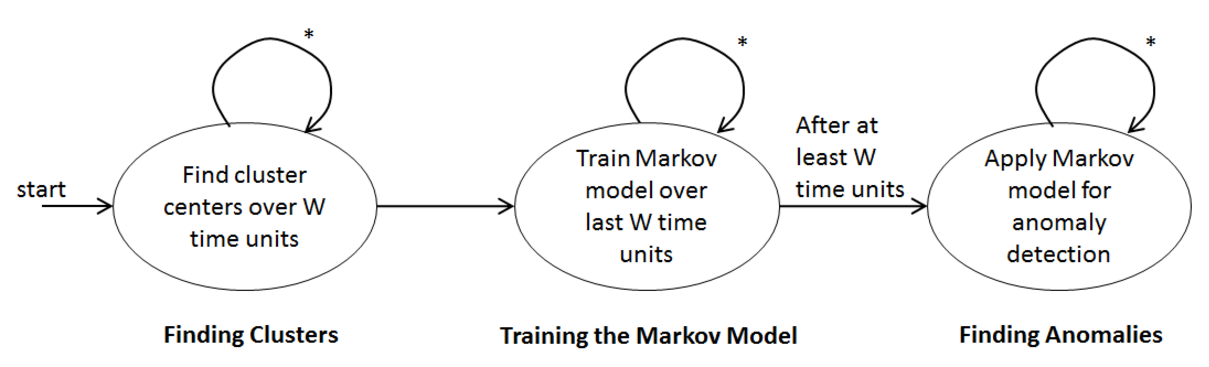
An event passes the sketched stages in sequence. This means that a changed cluster center must be considered in the subsequent stages right after the centers have changed. An event that causes a change of a cluster center first causes the update of the centers, then an update of the Markov model and is finally used in anomaly detection.
Finding Clusters
For each stateful dimension, find up to and maintain K cluster centers, using the numbers 1 to K as seeds for the initial K centroids. The number K is defined in the metadata for each dimension of each individual machine. Use all measurements from the last W time units to find the cluster centers.
The initial cluster centers for each dimension of measurements are determined by the first K distinct values for that dimension in the stream.
When recomputing the clusters after shifting the time window, the cluster centers are determined by the first K distinct values for that dimension in the given window.
If a given window has less than K distinct values than the number of clusters to be be computed must be equal to the number of distinct values in the window.
If a data point has the exact same distance to more than one cluster center, it must be associated with the cluster that has the highest center value.
The algorithm must compute M (e.g.: 50) iterations to find a clustering, unless it terminates earlier.
Training the Markov Model
Determine the transition probabilities by maintaining the count of transitions between all states in the last W time units. For determining a transition at time t, use the cluster centers that are valid at time t, i.e., no remapping of past observations to clusters in retrospect is required. Note, that also the current state that was reached prior to t, does not need to be reevaluated at t. Please also note that no two tuples for the same dimension have the same time stamp.
Finding Anomalies
Output an alert about a machine, if any sequence of up to N state transitions for that machine is observed that has a probability below T.
Please note that time is always defined as application time, i.e., as given by the timestamp of arriving tuples. Please also note that each new event is (1) first used to update the cluster centers, (2) then to update the Markov model, and (3) to compute the probability of the last up to N state transitions.
Parameters
All submitted solutions should be able to accommodate the following parameters:
- W: window size for finding cluster centers with k-means clustering and for training transition probabilities in Markov model.
- N: number of transitions to be used for combined state transition probability.
- M: number of maximum iterations for the clustering algorithm.
- Td: the maximum probability for a sequence of N transitions to be considered an anomaly. The value of Td is specified for each dimension d for which the clustering is performed.
Evaluation
The evaluation of the 2017 DEBS Grand Challenge is conducted using the automated evaluation platform provided by the European Union’s H2020 HOBBIT project (https://project-hobbit.eu/). In the following we provide a description of the evaluation platform and the evaluation procedure.
Please note that for both scenarios the result must be calculated in a streaming fashion, i.e.: (1) solutions must not make use of any pre-calculated information, such as indices, and (2) result streams must be updated continuously.
Platform Overview
The platform comprises of several components each single component is implemented as independent container. The communication between these components is done via a message bus. Docker (https://www.docker.com/) is used as a framework for the containerization and RabbitMQ (https://www.rabbitmq.com/) as message bus. Participants must provide all solutions as a docker containers. Each solution must read data from one message queue and output anomalies into another message queue provided by the evaluation platform.
Evaluation cluster has four nodes allocated for solutions. Each node is 2×64 bit Intel Xeon E5-2630v3 (8-Cores, 2,4 GHz, Hyperthreading, 20MB Cache, each proc.), 256 GB RAM, 1Gb Ethernet.
Registration and Submission
- Submission and registration procedure is documented here: https://github.com/hobbit-project/platform/wiki
- The evaluation platform can be reached under following address: http://master.project-hobbit.eu
Submission Procedure
Submission Stage 1:
At this stage you are requested to test your solution with the platform and send the organizers a link that proofs successful execution of your system. For this test, you need to set the parameter “Amount of messages” to 1000 and leave the other parameters at the default values.
Please send us an email with your team name, the names of its members and a link to the benchmarking result before the deadline. An example for such a link is provided below:
http://master.project-hobbit.eu/#/experiments/details?id=1493025697303
Submission Stage 2:
If you successfully passed stage 1, you are allowed to further work on your system until Friday the 5th of May 12 p.m. (noon) CET. At this point the benchmarking will close and we will use your latest solution to run the final benchmarks.
Evaluation Procedure and Criteria
The evaluation of each submitted solution will be performed by the evaluation platform. Both scenarios will be evaluated injecting tuples with an increasing rate modeled after a staircase function with a given period and step. For each solution, the evaluation platform keeps track of the different injection rates that can be sustained by the solution and their respective latency.
The latency is calculated as the difference between (1) the system clock time when the output tuple was put by the solution under evaluation into the output queue and (2) the system clock time when the last contributing input tuple was consumed by the solution from the input queue.

The score for each scenario is proportional to the sum of the sustained rates and inversely proportional to their respective latency. The total score (final ranking) of a solution is given by the sum of its scores for the two scenarios. The prize will be assigned to the solution that achieves the highest total score.
News / Changelog
- 2017.04.24 – The DEBS Grand Challenge deadline has been extended until the 28th of April 23:59 CET
- 2017.04.13 – Upon numerous requests the DEBS Grand Challenge deadline has been extended until the 24th of April 23:59 CET
- 2017.03.15 – DEBS parrot (Hello World) benchmark is ready. It sends certain amount of text messages and expects benchmarked system to send them back in the same order. We also provide an implementation of a system that can pass the benchmark. Source code, metadata, docker file can be found on GitHub: https://github.com/romromov/debs-parrotbenchmark-system
- 2017.03.07 – we will provide a Hello World example for the HOBBIT platform soon.
- 2017.03.07 – we have updated the deadlines for the availability of the performance evaluation on the HOBBIT platform.
- 2017.02.24 – after a brief downtime the the HOBBIT platform is back online.
- 2017.02.20 – We have just uploaded the correctness test to the platform. You can find it there under the name ‘DEBS GC Correctness benchmark’.
- 2017.02.02 – the HOBBIT platform (http://master.project-hobbit.eu) is back online.
- 2017.02.01 – please refer to the latest Q&A update in the mailing list in order to see the answers for common questions collected so far: http://debs.org/pipermail/gc/2017-January/000012.html
- 2017.01.27 – the deadlines for the Grand Challenge have been updated – the new submission deadline is the 7th of April!
- 2017.01.26 – the evaluation platform is currently down for maintenance and will be back online soon
- 2017.01.19 – the sample input data has been made available for download (please refer to the Data section) – the related output data will be made available at the end of January
- 2017.01.19 – we have updated the dates for the evaluation of correctness and performance
- 2017.01.19 – we have updated the k-means algorithm description to handle the case when a window has less than K distinct points
- 2017.01.19 – we have updated the description of the expected output (see section Output) stating that the output provided by each solution must be sorted
Q&A
For additional questions please refer to the Grand Challenge mailing list: http://debs.org/listinfo/gc and .
Important Dates
- April 7th -> April 28th, 2017: GC solutions due (submission system closes)
March 17th, 2017: Evaluation platform supports single node and distributed performance testsMarch 14th, 2017: Hello World example for HOBBIT evaluation platformFebruary 17th, 2017: Evaluation platform supports correctness testsDecember 17th, 2016: Evaluation platform online (team registration open)December 1st, 2016: Problem description (incl. sample data) online
Organizers
- Vincenzo Gulisano – Chalmers University of Technology
- Roman Katerinenko – AGT International
- Zbigniew Jerzak – SAP SE
- Martin Strohbach – AGT International
- Holger Ziekow – Hochschule Furtwangen